Remote machine debugging with Windows 8
A nice feature we had in the Windows phone days was the ability to plug in your device and test your code running on it, if you had more than one device (about 7 in my case) then you just had to swap the device over and you were off again, however this did have some drawbacks, namely:
- The device had to be tethered to the PC to deploy / debug
- You could not do disconnected debugging using the device’s Wi-Fi/3G connections with it tethered
Now enter Win 8 and they have taken the debug options up a notch building on the remote debugging features of VS pro and above by allowing you to install a client on the target machine and push your apps to it and debug them, all without a single wire (unless you count the power cord). Even better is this facility is also available in the express editions.
Setting it up
Getting up and running could not be easier, just download the “remote tools” for your device from the MS downloads site and install it on your remote machine.
Once installed you will find a nice new shiny icon on your Windows 8 desktop (even though it does not appear to be a “Windows 8 Store” codename “M” app)
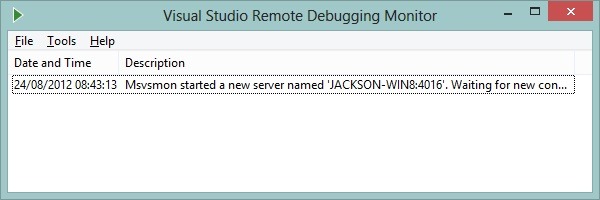
On launching it your get a nice dialog windows who’s sole purpose is to let you know what’s going on, who’s connected and when.
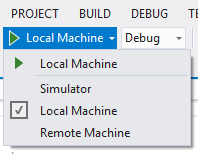
Next in your Visual Studio 2012 installation you will have an option to run your app in several different ways via this icon:
As you can see we have the options for running the app on our development machine, in a simulator and new just in, the ability to deploy and debug on a remote machine (provided you have installed the tools first!!)
First Run
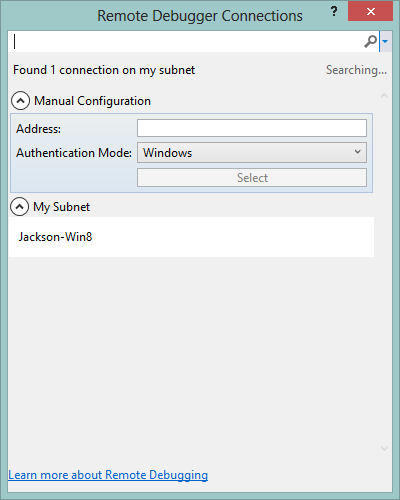
Now on first run you will get prompted to search and select the machine you want to deploy your app to:
As you would expect it is nice and simple and gives you browsing options (for your local Subnet only, if you do not know what a Subnet is just think computers near you), granted the browsing options will also depend on your PC’s firewall settings and the general network setup (for instance my corporate LAN does not allow this kind of browsing so it does not work)
As a backup 9and for picky people I guess) you can also enter either the name or the IP4 address of the target machine, e.g. 192.168.0.3.
Once connected your up and running, deploy as many times as you like with no ill effects.
One curious side note, if you also happen to have Visual Studio installed on the target machine it may also prompt you to request a store development license to run “side loaded” apps, this does not happen with just the tools installed alone, saying that i have found it to be very intermittent.
But what if I want to change the target device
Now most who know me know i do not do titbit posts or just regurgitate what is already in the MSDN library or docs that come with a product, so why the post.
Simple reason, the story does not end here.
For work I had to use the tablets IP address to connect as i could not browse for it and I was up and running, but on returning home I also wanted to test and for obvious reasons my tablet when connected at home does not have the same address as my work place (because I’m not at work if you are still wondering!)
So I fired up the tools and attempted to deploy my app again, EXCEPT it is still looking for my work address and so began the hunt and the reason for this post, how to select a DIFFERENT machine.
several options were pointed out to be following a desperate plea on twitter and other avenues, such as:
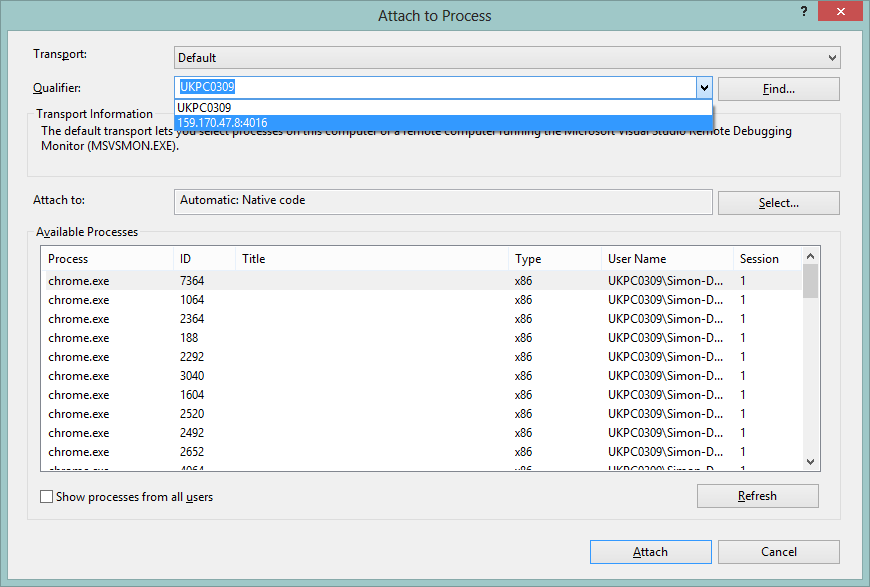
- Attach to Process settings
in VS Pro and above (not Express) you can attach to the process of another running app (extremely useful when your Blend designer is not playing ball), here you can change the “qualifier” (read Target machine) that you want to attach to.
However this does not change the current target Debug machine for remote debugging.
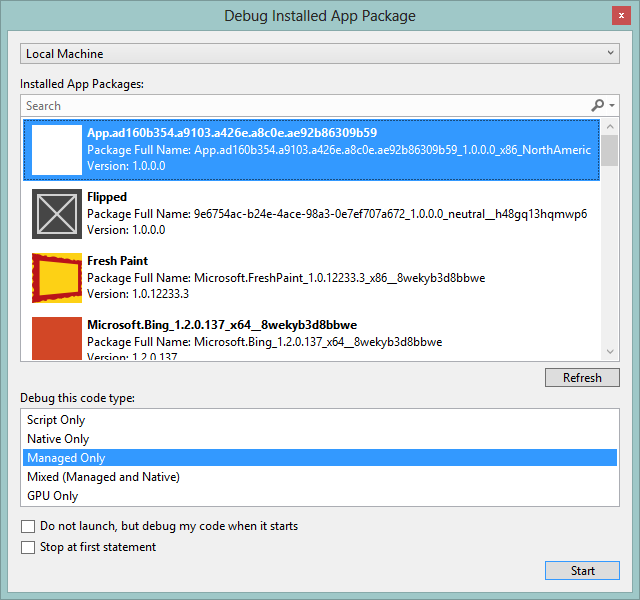
- Debug installed app package
Located in “Debug –> Debug installed app package”, another new feature exists in VS 2012 that allows you to debug any installed application, you can even select another machine running the remote tools as well by changing the combo box at the top.
However this also does not change the current target Debug machine for remote debugging.
Eventually in my desperation after wading through a number of other help avenues i stumbled on the answer.
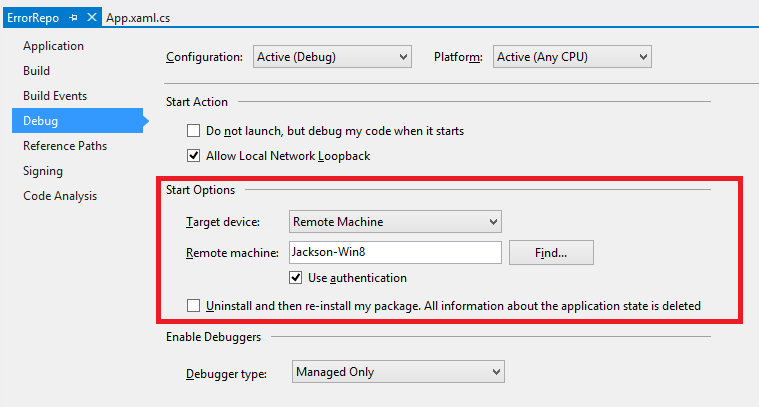
Project Properties / Debug
Kind of hidden in the properties for your runtime project (not the solution!) on the debug tab are the start options which show you which deployment method you are currently using and for remote deployments lets you select the specific remote machine.
Clicking on “Find” bring back up the original “Remote Debugger Connections” dialog and lets you select a different machine.
This should really be available from the “Remote” button in the main window and it is not very well documented (well anywhere that I looked)
Back to work
Now I’ve got a game to finish porting, so if there nothing else holding me up testing my app then I’m back to the grindstone.
